|
Headlines |
Mar-22 |
Feb-22 |
|
Monthly Index* |
529.6 |
523.8 |
|
Monthly Change* |
1.1% |
1.7% |
|
Annual Change |
14.3% |
12.6% |
|
Average Price (not seasonally adjusted) |
£265,312 |
£260,230 |
* Seasonally adjusted figure (note that monthly % changes are revised when seasonal adjustment factors are re-estimated)
Commenting on the figures, Robert Gardner, Nationwide's Chief Economist, said:
“March saw a further acceleration in annual house price growth to 14.3%, the strongest pace of increase since November 2004. Prices rose by 1.1% month-on-month, after taking account of seasonal effects, the eighth consecutive monthly increase.
“The price of a typical UK home climbed to a new record high of £265,312, with prices increasing by over £33,000 in the past year. Prices are now 21% higher than before the pandemic struck in early 2020.
“The housing market has retained a surprising amount of momentum given the mounting pressure on household budgets and the steady rise in borrowing costs. The number of mortgages approved for house purchase remained high in February at around 71,000, nearly 10% above pre-pandemic levels. A combination of robust demand and limited stock of homes on the market has kept upward pressure on prices.
“The continued buoyancy of housing demand may in part be explained by strong labour market conditions. The unemployment rate has continued to trend down in recent months (to 3.9% in the three months to January) from already low levels. Wage growth has accelerated, though it is running below inflation.
“The significant savings accrued during lockdowns is also likely to have helped prospective homebuyers raise a deposit. We estimate that households accrued an extra c£190bn of deposits over and above the pre-pandemic trend since early 2020, due to the impact of Covid on spending patterns. This is equivalent to around £6,500 per household, although it is important to note that these savings were not evenly spread, with older, wealthier households accruing more of the increase.
“Nevertheless, we still think that the housing market is likely to slow in the quarters ahead. The squeeze on household incomes is set to intensify, with inflation expected to rise further, perhaps reaching double digits in the quarters ahead if global energy prices remain high. Moreover, assuming that labour market conditions remain strong, the Bank of England is likely to raise interest rates further, which will also exert a drag on the market if this feeds through to mortgage rates.
Most regions see price growth accelerate
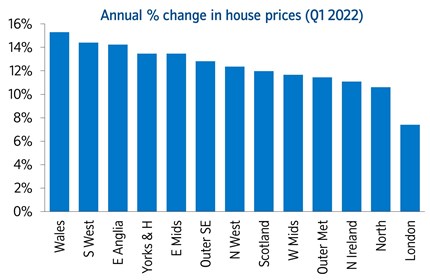
“Our regional house price indices are produced quarterly, with data for Q1 (the three months to March) showing an acceleration in annual house price growth in all but two regions (Wales and Northern Ireland - see table on page 4).
“Wales remained the strongest performing region with house prices up 15.3% year-on-year, down slightly from 15.8% in the previous quarter. Northern Ireland also saw a slight slowing in annual price growth to 11.1%. Meanwhile, Scotland saw a 12% year-on-year rise in house prices, the strongest rate of growth since the third quarter of 2007.

“England saw annual price growth increase to 11.6%, from 9.0% in Q4 2021. All English regions saw an acceleration, with the South West remaining the strongest, recording annual house price growth of 14.4%, the highest since 2004. This was closely followed by East Anglia, which saw annual price growth of 14.2%, up from 10.4% in the previous quarter.
“Meanwhile in northern England, Yorkshire & the Humber was the strongest performing region, with prices up 13.5% year-on-year, the strongest rate of growth since Q1 2005.
“London was again the weakest performer in the UK, although it did see a noticeable uptick in annual price growth in the first quarter to 7.4%, compared with 4.2% in Q4 2021.
Detached properties have seen the strongest price growth through the pandemic
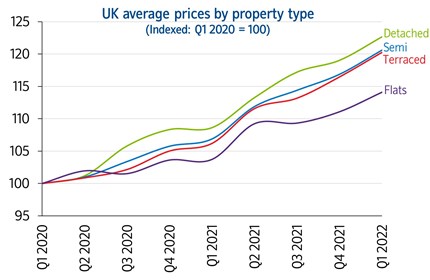
“Shifts in housing preferences as a result of the pandemic have been a significant driving factor of housing market activity over the past two years. Last year, our research identified a ‘race for space’ and this was reflected in price trends by property type, with detached homes seeing the strongest growth and flats the weakest.
“Between Q1 2020 and Q1 2022, the average price of a detached property increased by 22.6%, nearly £68,000 in cash terms. Meanwhile, over the same period, flats only increased by 14.1%, around £24,000 in cash terms. The chart below illustrates how the price of different property types has evolved since the pandemic began.

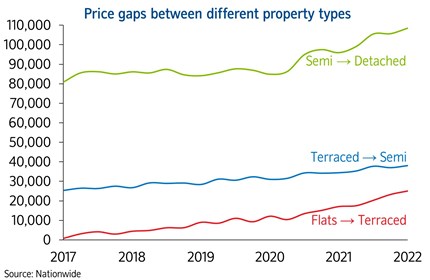
“Consequently, it is becoming more difficult for existing homeowners to trade up, with the price gaps between different property types now at a record high. This is particularly acute for those looking to move from flats to terraced houses, where the price gap has more than doubled since the onset of the pandemic (from around £12,000 to over £25,000).

“However, in many cases households have managed to bridge this gap by moving to a cheaper region. For example ONS / Land Registry data[1] shows that the price of a typical flat in London is around £428,000, while a detached property in the East Midlands costs around £350,000.”
Quarterly Regional House Price Statistics (Q1 2022)
Regions over the last 12 months
|
Region |
Average Price (Q1 2022) |
Annual % change this quarter |
Annual % change last quarter |
|
Wales |
£201,502 |
15.3% |
15.8% |
|
South West |
£300,936 |
14.4% |
11.5% |
|
East Anglia |
£277,332 |
14.2% |
10.4% |
|
Yorks & the Humber |
£199,235 |
13.5% |
10.8% |
|
East Midlands |
£227,275 |
13.5% |
10.4% |
|
Outer S East |
£337,094 |
12.8% |
11.3% |
|
North West |
£204,511 |
12.4% |
11.2% |
|
Scotland |
£178,289 |
12.0% |
10.1% |
|
West Midlands |
£233,136 |
11.7% |
9.4% |
|
Outer Met |
£422,428 |
11.4% |
8.8% |
|
N Ireland |
£171,095 |
11.1% |
12.1% |
|
North |
£153,029 |
10.6% |
7.7% |
|
London |
£518,333 |
7.4% |
4.2% |
|
UK |
£260,771 |
12.6% |
10.1% |
UK Fact File (Q1 2022) |
|
|
Quarterly average UK house price |
£260,771 |
|
Annual percentage change |
12.6% |
|
Quarterly change* |
3.0% |
|
Most expensive region |
London |
|
Least expensive region |
North |
|
Strongest annual price change |
Wales |
|
Weakest annual price change |
London |
* Seasonally adjusted
Nations – annual & quarterly price change
|
Nation |
Average Price (Q1 2022) |
Annual % change this quarter |
Quarterly % change* |
|
Wales |
£201,502 |
15.3% |
2.8% |
|
Scotland |
£178,289 |
12.0% |
4.1% |
|
England |
£297,928 |
11.6% |
2.8% |
|
N Ireland |
£171,095 |
11.1% |
1.8% |
* Seasonally adjusted
-ends-