|
Headlines |
Nov-22 |
Oct-22 |
|---|---|---|
|
Monthly Index* |
528.2 |
535.9 |
|
Monthly Change* |
-1.4% |
-0.9% |
|
Annual Change |
4.4% |
7.2% |
|
Average Price (not seasonally adjusted) |
£263,788 |
£268,282 |
* Seasonally adjusted figure (note that monthly % changes are revised when seasonal adjustment factors are re-estimated)
Commenting on the figures, Robert Gardner, Nationwide's Chief Economist, said:
“The fallout from the mini-Budget continued to impact the market, with November seeing a sharp slowdown in annual house price growth to 4.4%, from 7.2% in October. Prices fell by 1.4% month-on-month, after taking account of seasonal effects, the largest fall since June 2020.
“While financial market conditions have stabilised, interest rates for new mortgages remain elevated and the market has lost a significant degree of momentum. Housing affordability for potential buyers and home movers has become much more stretched at a time when household finances are already under pressure from high inflation.
“The market looks set to remain subdued in the coming quarters. Inflation is set to remain high for some time and Bank Rate is likely to rise further as the Bank of England seeks to ensure demand in the economy slows to relieve domestic price pressures.
“The outlook is uncertain, and much will depend on how the broader economy performs, but a relatively soft landing is still possible.
“Longer term borrowing costs have fallen back in recent weeks and may moderate further, especially if investors continue to revise down their expectations for the future path of Bank Rate. Given the weak growth outlook, labour market conditions are likely to soften, but they are starting from a robust position with unemployment still near 50-year lows.
“Moreover, household balance sheets remain in good shape with significant protection from higher borrowing costs, at least for a period, with around 85% of mortgage balances on fixed interest rates. Stretched housing affordability is also a reflection of underlying supply constraints, which should provide some support for prices.
Affordability becoming more stretched
“Even before the recent increases in mortgage rates, affordability was becoming more stretched across the UK, though with considerable regional variation.
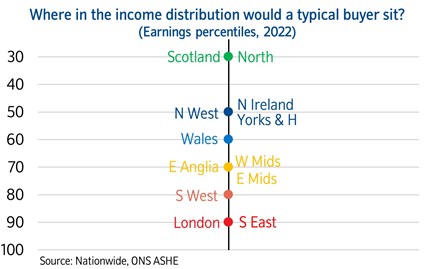
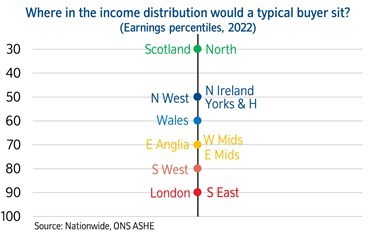
“To explore how this is impacting potential buyers we used regional income data to calculate where in the income distribution a prospective purchaser would sit if they were purchasing the typical first-time buyer property in each region, with a 20% deposit and borrowing four times their income. If the typical buyer is located higher in the income distribution it suggests affordability is more stretched, with more people priced out of the market.
“In broad terms, the picture that emerges is that this hypothetical typical buyer is located further up the income spectrum as you go from the north to south of the country.
“For example, in Scotland and the North of England, this typical buyer would be in the 30th income percentile, while in the South West they would be in the 80th percentile, and above the 90th percentile in London and the South East.
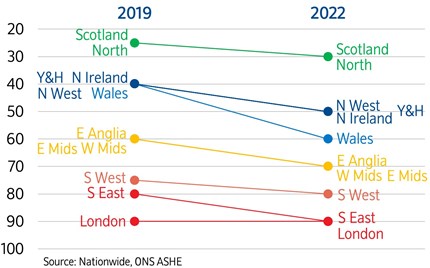
“As shown in the chart below, some regions have seen a more pronounced deterioration in affordability in recent years than others. In Scotland and the North region, the typical buyer is now located in the 30th percentile, compared with the 25th percentile in 2019, before the pandemic struck. Similarly, in East Anglia, East Midlands and West Midlands, the typical buyer has moved from the 60th percentile to the 70th percentile.
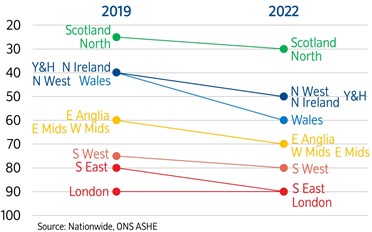
“However, the biggest deterioration in affordability since 2019 has been in Wales, with the typical buyer now located in the 60th income percentile, compared to the 40th percentile in 2019.
“A higher income percentile signals that a larger proportion of people are priced out of the market or needing to borrow a greater income multiple to buy a home. Conditions remain most stretched in the capital; in 2019 the typical London buyer was already located above the 90th income percentile. The surrounding South East region has now joined it, with the typical buyer moving from the 80th income percentile in 2019.”
-ends-