Venture Capital Trusts statistics: 2021
Published 20 January 2022

© Crown copyright 2022
This publication is licensed under the terms of the Open Government Licence v3.0 except where otherwise stated. To view this licence, visit nationalarchives.gov.uk/doc/open-government-licence/version/3 or write to the Information Policy Team, The National Archives, Kew, London TW9 4DU, or email: psi@nationalarchives.gov.uk.
Where we have identified any third party copyright information you will need to obtain permission from the copyright holders concerned.
This publication is available at https://www.gov.uk/government/statistics/venture-capital-trusts-2021/venture-capital-trusts-statistics-2021
1. Main findings
The number of companies operating as Venture Capital Trusts (VCTs) has decreased in the tax year 2020 to 2021, though the amount of investment raised by the remaining VCTs has increased year on year.
The amounts claimed as tax relief fell in 2019 to 2020, reflecting a drop in funds raised by VCTs in that tax year. Amounts claimed as tax relief are reported with a one year time delay due to the nature of the Self Assessment reporting system (see ‘2.1 About these statistics’).
The main headlines are:
- Venture Capital Trusts (VCTs) issued shares to the value of £668 million in 2020 to 2021, which is 4% higher in comparison to 2019 to 2020 (£645 million)
- the number of VCTs raising funds has decreased by 3 in 2020 to 2021 (40)
- the number of VCTs managing funds has decreased by 4 in 2020 to 2021 (57)
- in 2019 to 2020, Venture Capital Trust (VCT) investors claimed Income Tax relief on £575 million of investment, which is a decrease of 16% from 2018 to 2019
- the number of VCT investors who claimed Income Tax relief decreased by 11% to 17,725 in 2019 to 2020
2. Introduction
2.1 About these statistics
This is an annual National Statistics publication of Venture Capital Trusts (VCTs) statistics.
Section 3 (number of VCTs and funds raised) includes figures covering the period up to tax year 2020 to 2021. Section 4 (investors claiming relief on VCT investments) includes first estimates for 2019 to 2020. The deadline for submitting Self Assessment returns for the tax year 2020 to 2021 has not yet passed and individuals can also submit late claims, therefore the data for 2020 to 2021 is currently incomplete for publication.
This year, several changes have been made to the layout of this publication. These have been introduced to improve the accessibility and readability of the statistics. Table 8.6, 8.9a and 8.9b from the previous release have been renamed to Table 1, 2a and 2b respectively. Information about the data sources and methodology can now be found in the Background quality report.
In Table 1, figures for 2019 to 2020 are revised and 2020 to 2021 are provisional.
In Table 2a and 2b, figures prior to 2019 to 2020 are revised and 2019 to 2020 are provisional.
The next release of these statistics will be in December 2022. If you would like to comment on these statistics, please see the contacts named at the end.
2.2 What are Venture Capital Trusts?
The VCT scheme, introduced in 1995, is one of four tax-based venture capital schemes. VCTs raise funds for investments, normally annually, through new and/or top-up share issues to investors.
For more information about Venture Capital Trusts and the policy background, see the Venture Capital Trusts statistics: Introductory note.
3. Amount of funds raised and number of Venture Capital Trusts
Venture Capital Trusts (VCTs) have raised funds to the value of £668 million in 2020 to 2021, which is 4% higher than in 2019 to 2020 (£645 million).
Amount raised has been rounded to the nearest £5 million for data up to 2016 to 2017 and £1 million for 2017 to 2018 onwards.
Table 1: Amount of funds raised (£ million) and number of Venture Capital Trusts (VCTs) by year, 1995-96 to 2020-21
| Year | Funds raised (£m) | VCTs raising funds | VCTs managing funds | Rate of Income Tax relief (%) |
|---|---|---|---|---|
| 1995-96 | 160 | 12 | 12 | 20 |
| 1996-97 | 170 | 13 | 18 | 20 |
| 1997-98 | 190 | 16 | 26 | 20 |
| 1998-99 | 165 | 11 | 34 | 20 |
| 1999-00 | 270 | 20 | 43 | 20 |
| 2000-01 | 450 | 38 | 61 | 20 |
| 2001-02 | 155 | 45 | 70 | 20 |
| 2002-03 | 70 | 32 | 71 | 20 |
| 2003-04 | 70 | 31 | 71 | 20 |
| 2004-05 | 520 | 58 | 98 | 40 |
| 2005-06 | 780 | 82 | 108 | 40 |
| 2006-07 | 270 | 32 | 121 | 30 |
| 2007-08 | 230 | 54 | 131 | 30 |
| 2008-09 | 150 | 46 | 129 | 30 |
| 2009-10 | 340 | 68 | 122 | 30 |
| 2010-11 | 350 | 78 | 128 | 30 |
| 2011-12 | 325 | 76 | 124 | 30 |
| 2012-13 | 400 | 65 | 118 | 30 |
| 2013-14 | 440 | 66 | 97 | 30 |
| 2014-15 | 435 | 57 | 94 | 30 |
| 2015-16 | 445 | 45 | 80 | 30 |
| 2016-17 | 570 | 38 | 75 | 30 |
| 2017-18 | 705 | 43 | 68 | 30 |
| 2018-19 | 716 | 42 | 61 | 30 |
| 2019-20 | 645 | 43 | 61 | 30 |
| 2020-21 | 668 | 40 | 57 | 30 |
Figure 1: Amount of funds raised by VCTs (£ million), 1995-96 to 2020-21
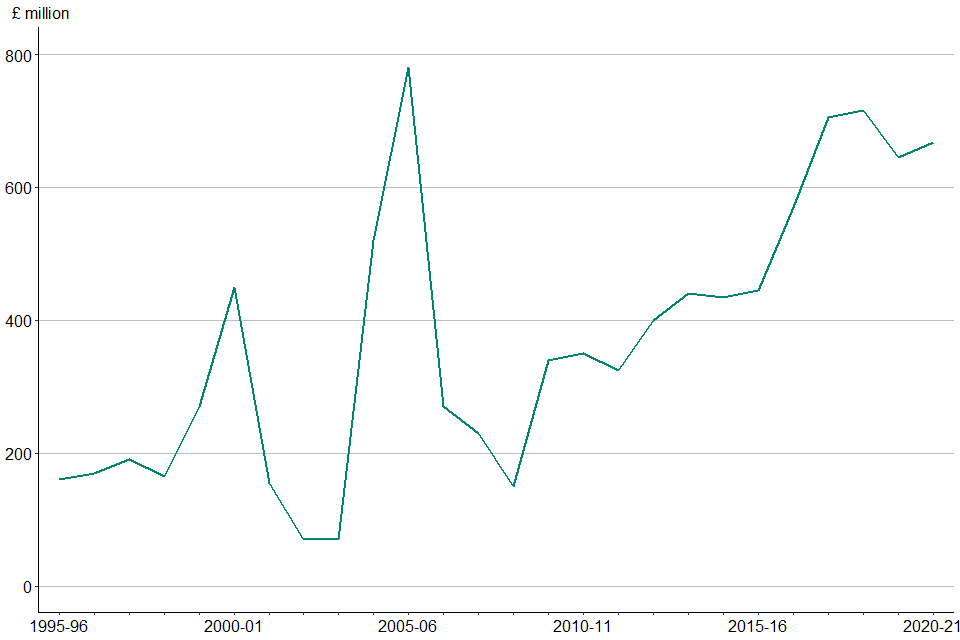
As seen in Figure 1, the amount of funds raised by VCTs has been on a rising trend in recent years and has more than doubled since 2009 to 2010. Several rules which were introduced during the period, namely the restricted enhanced share buybacks from April 2014 and the government’s Patient Capital Review consultation in summer 2017, may partly explain the increased fund raising between tax year 2014 to 2015 and tax year 2017 to 2018, as VCTs anticipated possible changes to the rules of the scheme. The increase in the Income Tax relief rate to 40% saw peak funds raised in 2005 to 2006 from the previous year.
As well as anticipation of changes from the Patient Capital Review, the increase in funds raised during tax year 2017 to 2018 and tax year 2018 to 2019 is likely due to the reduction of the lifetime allowance from £1.25 million to £1 million. This made traditional pensions less attractive, and the introduction of pension freedoms which allow for cash to be taken out of the pot for investment rather than buying an annuity, meaning there is more freedom for investment in alternatives such as VCTs.
The slight decrease in funds raised in 2019 to 2020 is likely to be a reaction to the VCT reforms introduced in 2017, but which came into effect during later accounting periods and potentially due to the impacts of Covid-19 towards the end of the tax year.
Figure 2: Number of VCTs raising and managing funds, 1995-96 to 2020-21
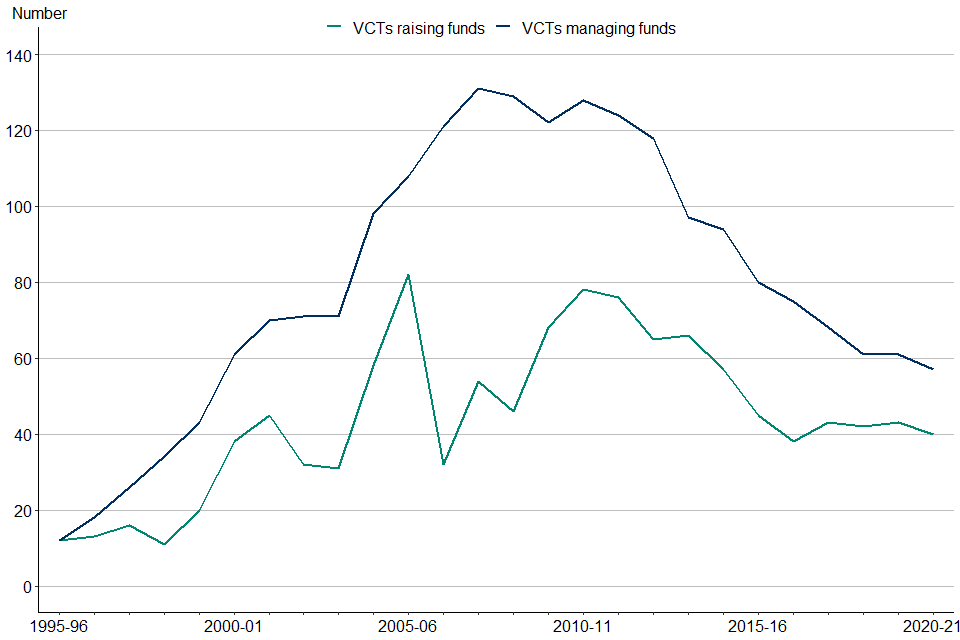
The number of Venture Capital Trusts (VCTs) raising funds in 2020 to 2021 has decreased to 40 from the previous year. In the past, the amount of funds raised by VCTs and the number of VCTs raising funds have been closely linked. However, this has been less evident in recent years where similar amounts of funds have been raised by a smaller number of larger VCTs.
A reduction in the Income Tax relief rate to 30% in 2006 to 2007 was accompanied by a sharp fall in activity to £270 million raised by 32 VCTs, and activity remained relatively low until 2009 to 2010. The amount raised by VCTs has remained stable from tax year 2014 to 2015 to tax year 2015 to 2016. However, tax year 2017 to 2018 saw a rise to £705 million raised by 43 VCTs and; £716 million in 2018 to 2019 by 42 VCTs.
There has been a slight increase in the amount raised by VCTs in 2020 to 2021, though the number of VCTs raising funds has decreased, reflecting further concentration of the VCT market. As shown in Figure 2, Venture Capital Trusts (VCTs) have been merging over time to achieve economies of scale.
VCTs managing funds include VCTs which raised funds in the tax year and also those VCTs which managed funds raised in previous years. The number of VCTs managing funds has decreased in 2020 to 2021 as a few VCTs have ceased to be active. Since 2010 to 2011, the number of VCTs managing funds has generally been decreasing, dropping to 57 in 2020 to 2021.
4. Investors claiming Income Tax relief and amounts invested
The amount of VCT investment on which Income Tax relief was claimed decreased by 16% in 2019 to 2020, compared to the previous year. The number of investors decreased by 11% to 17,725 in 2019 to 2020. This information only covers claims made through Self Assessment and will not cover investors making Income Tax relief claims through other systems (for example PAYE) or not making any claims.
Table 2a and Table 2b presents the distribution of investors claiming Income Tax relief under the VCT scheme, and the amounts invested.
Total figures provided in Table 2a and 2b on the amount of investment on which Income Tax relief was claimed are not directly comparable with the figures on the amount of investment received by VCTs in a tax year shown in Table 1, as an amount of relief would be claimed outside Self Assessment, or not claimed at all.
4.1 Number of investors claiming VCT relief
Most investors tend to invest under £50,000 into VCT funds. The average amount invested by an individual in 2019 to 2020 was around £32,000.
Numbers have been rounded to the nearest 5. Totals may not sum due to rounding.
Table 2a: Number of investors claiming VCT relief by size of investment, 2017-18 to 2019-20
| Investment band | 2017-18 | 2018-19 | 2019-20 |
|---|---|---|---|
| Up to £1,000 | 1,285 | 1,440 | 1,585 |
| £1,000 to £2,500 | 830 | 1,005 | 1,235 |
| £2,500 to £5,000 | 1,745 | 1,965 | 1,770 |
| £5,000 to £10,000 | 3,505 | 3,600 | 3,110 |
| £10,000 to £15,000 | 1,730 | 1,815 | 1,475 |
| £15,000 to £20,000 | 1,895 | 1,870 | 1,645 |
| £20,000 to £25,000 | 1,160 | 1,265 | 1,065 |
| £25,000 to £50,000 | 3,415 | 3,410 | 2,855 |
| £50,000 to £75,000 | 1,030 | 1,040 | 870 |
| £75,000 to £100,000 | 995 | 950 | 800 |
| £100,000 to £150,000 | 540 | 530 | 430 |
| £150,000 to £200,000 | 1,005 | 1,035 | 885 |
| Total | 19,130 | 19,930 | 17,725 |
Figure 3: Distribution of the proportion of investors claiming VCT relief by size of investment, 2018-19 to 2019-20
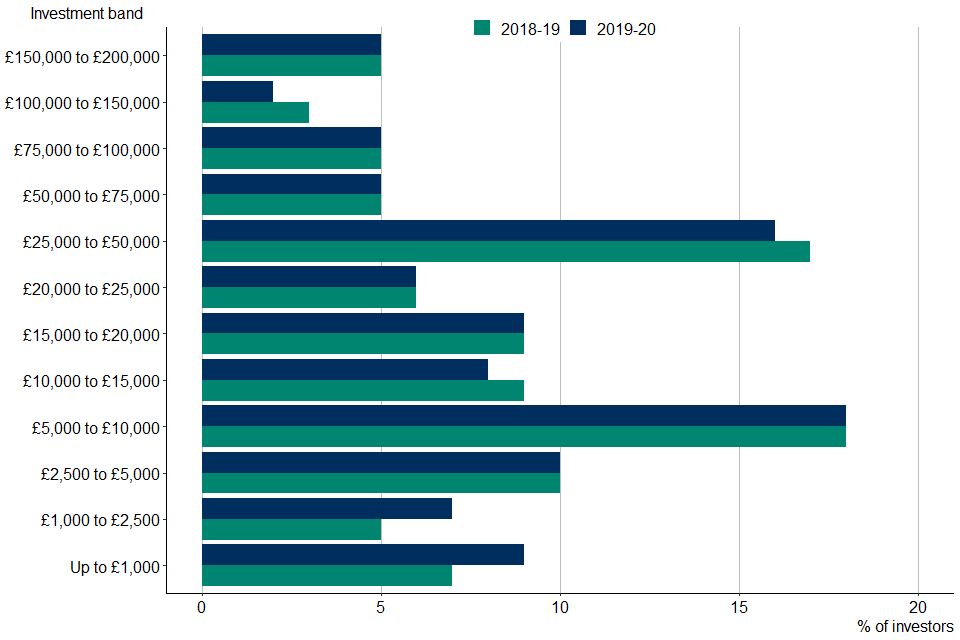
In 2019 to 2020, there was a significant decrease in the number of VCT investors compared to the previous year. However, this is consistent with the reduction in funds raised by VCTs in 2019 to 2020 (see Table 1). This is likely an impact of the reforms to VCT investment conditions which were introduced in 2017 but began to take effect in later accounting periods. The Covid-19 pandemic also may have acted to reduce investment towards the end of 2019 to 2020 as uncertainty increased across the economy.
Figure 3 shows the distribution of the investors claiming VCT relief grouped by size of investment. Around 83% of VCT investors claimed tax relief under the VCT scheme for an investment of £50,000 or less; the largest number being in the £5,000 to £10,000 group (18%) and £25,000 to £50,000 group (16%). In 2019 to 2020 the proportion of VCT investors in the higher investment size categories (above £25,000) has decreased from 2018 to 2019.
Figure 4: Number of investors claiming VCT relief via Self Assessment, 2004-05 to 2019-20
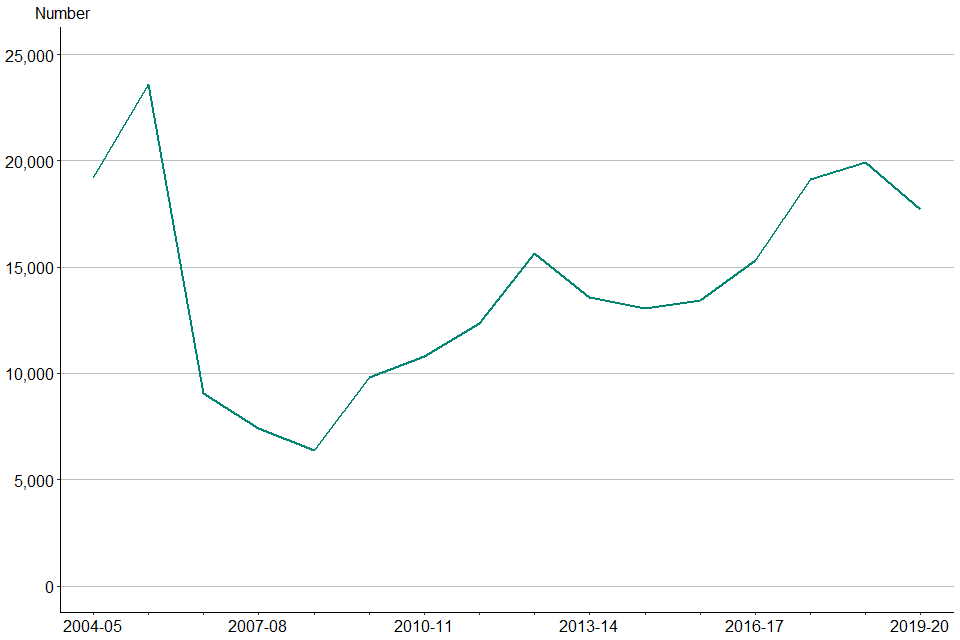
Figure 4 shows a time series of the number of investors who have claimed VCT relief from 2004 to 2005. The tax year 2018 to 2019 saw the largest number of investors since 2005 to 2006. This reflects the increase in funds raised seen in Figure 1 as a result of pension changes and the Patient Capital Review.
4.2 Amounts invested by VCT investors
Similar to the number of investors, Table 2b shows a significant decrease (16%) in the amount of relief claimed by VCT investors in 2019 to 2020.
Amounts have been rounded to the nearest £5 million. Totals may not sum due to rounding.
Table 2b: Amount of investment (£ million) on which VCT relief was claimed by size of investment, 2017-18 to 2019-20
| Investment band | 2017-18 | 2018-19 | 2019-20 |
|---|---|---|---|
| Up to £1,000 | <5 | <5 | <5 |
| £1,000 to £2,500 | <5 | <5 | <5 |
| £2,500 to £5,000 | 5 | 10 | 5 |
| £5,000 to £10,000 | 30 | 30 | 25 |
| £10,000 to £15,000 | 25 | 25 | 20 |
| £15,000 to £20,000 | 35 | 35 | 30 |
| £20,000 to £25,000 | 25 | 30 | 25 |
| £25,000 to £50,000 | 130 | 130 | 110 |
| £50,000 to £75,000 | 65 | 65 | 55 |
| £75,000 to £100,000 | 95 | 90 | 75 |
| £100,000 to £150,000 | 65 | 65 | 55 |
| £150,000 to £200,000 | 195 | 200 | 175 |
| Total | 675 | 685 | 575 |
Figure 5: Distribution of the proportion of investment for which VCT relief was claimed by size of investment, 2018-19 to 2019-20
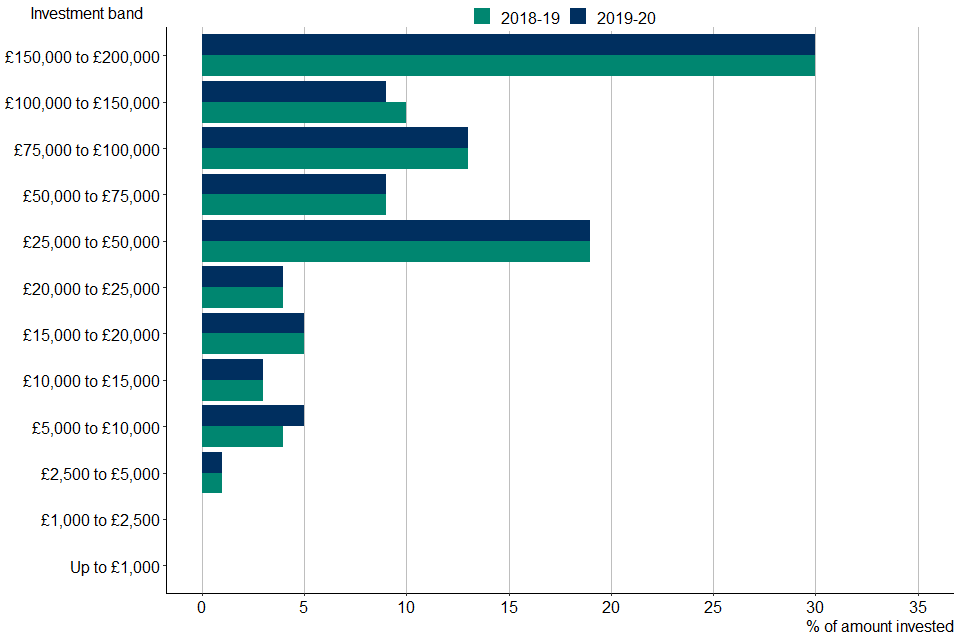
In Figure 5, we see that the largest category of investment by amount in 2019 to 2020 was investments between £150,000 to £200,000. More precisely, 30% of the total amount invested is accounted for by only 5% of investors.
Figure 6: Comparison of the amount of investment on which relief was claimed via Self Assessment and total funds raised (£ million), 2004-05 to 2019-20
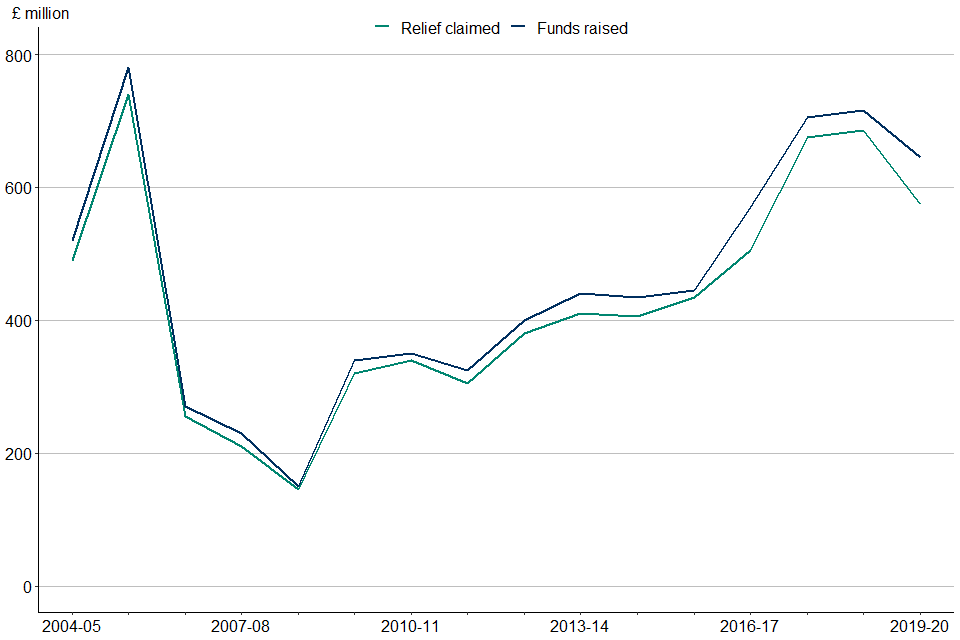
Figure 6 shows that the amount of relief claimed and total funds raised by VCTs are largely consistent year on year. In 2019 to 2020, around 89% of the total VCT investments were claimed through Self Assessment. The remaining amounts are assumed to be either claimed outside Self Assessment or not claimed at all.
5. Contact
Statistical contacts: S Nath and G Dobson; venturecapital.statistics@hmrc.gov.uk
Queries relating to investing in VCTs: Venture Capital Reliefs Team; enterprise.centre@hmrc.gov.uk