Personal Incomes Statistics 2019 to 2020: Summary for tables 3.12 to 3.15a
Published 13 April 2022

© Crown copyright 2022
This publication is licensed under the terms of the Open Government Licence v3.0 except where otherwise stated. To view this licence, visit nationalarchives.gov.uk/doc/open-government-licence/version/3 or write to the Information Policy Team, The National Archives, Kew, London TW9 4DU, or email: psi@nationalarchives.gov.uk.
Where we have identified any third party copyright information you will need to obtain permission from the copyright holders concerned.
This publication is available at https://www.gov.uk/government/statistics/personal-incomes-tables-312-to-315a-for-the-tax-year-2019-to-2020/personal-incomes-statistics-2019-to-2020-summary-for-tables-312-to-315a
1. Introduction
About this publication
Tables 3.12 to 3.15a provide further geographical breakdowns to Tables 3.1 to 3.11 which were published in March 2022.
The Survey of Personal Incomes (SPI) is based on information held by HM Revenue and Customs (HMRC) on individuals who could be liable to UK Income Tax. It is carried out annually by HMRC and covers income assessable to tax for each tax year.
Most tables in this statistics release exclude individuals who are not taxpayers. This can occur for a number of reasons, for example if they have no Income Tax liability due to their deductions, reliefs and personal allowances exceeding their total income, or if their income is below the Personal Allowance. Figures cover the UK and tax year 2019 to 2020 unless stated otherwise.
The SPI is compiled to provide information to the public, Members of Parliament, other government departments, companies, and organisations. It is a quantified evidence base from which to cost proposed changes to tax rates, personal allowances and other tax reliefs for Treasury ministers. It is used to inform policy decisions within HMRC, the Treasury and the devolved administrations, as well as for tax modelling and forecasting purposes. In addition, it is used to provide summary information for the National Accounts that are prepared by the Office for National Statistics.
Supporting documents to the SPI annual publication are:
-
accompanying statistical tables by tax year in Tables 3.12 to 3.15a
-
accompanying statistical tables and supporting documentation on the methodology used to produce these statistics is available on our website for the tax year 2019 to 2020 Personal incomes: tables 3.1 to 3.11, 3.16 and 3.17 for the tax year 2019 to 2020
2. Taxpayers of pension age
Taxpayers of pension age are those over the State Pension Age (SPA), which for the purposes of these statistics is aged 65.75 for females and males as at 5 April 2020.
There were 6.25 million taxpayers of pension age for the tax year 2019 to 2020; of these 59.3% are male and 40.7% are female. (Table 3.12)
The number of taxpayers of pension age decreased 4.1% since the previous tax year. They account for 19.9% of all taxpayers and 15.3% of total income.
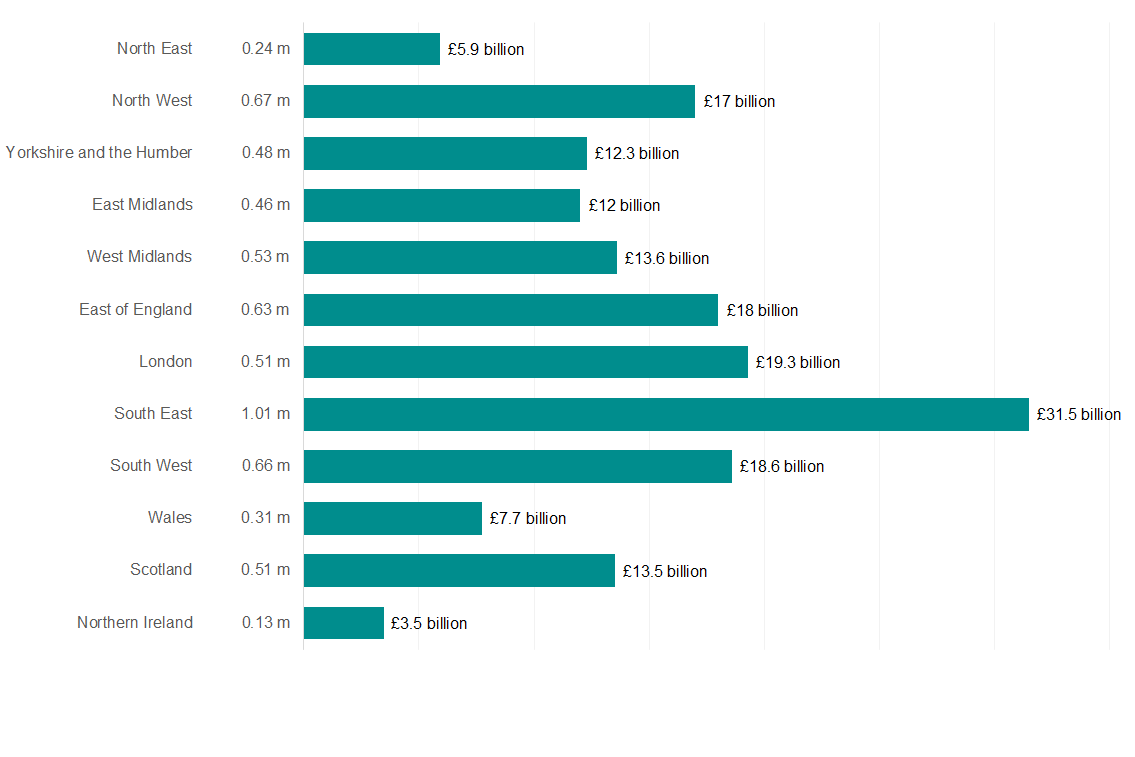
The South East has the highest number of taxpayers of pension age and the largest amount of total income (1.01 million and £31.5 billion respectively). Northern Ireland has the fewest taxpayers of pension age and the lowest amount of total income (126,000 and £3.5 billion respectively) (Table 3.12).
Figure 2.1: Number of taxpayers of pension age and total income in the tax year ending 2019
| Region | Taxpayers (m) | Total Income (£b) |
|---|---|---|
| North East | 0.24 | £5.9 |
| North West | 0.67 | £17 |
| Yorkshire and the Humber | 0.48 | £12.3 |
| East Midlands | 0.46 | £12 |
| West Midlands | 0.53 | £13.6 |
| East of England | 0.63 | £18 |
| London | 0.51 | £19.3 |
| South East | 1.01 | £31.5 |
| South West | 0.66 | £18.6 |
| Wales | 0.31 | £7.7 |
| Scotland | 0.51 | £13.5 |
| Northern Ireland | 0.13 | £3.5 |
Source: Survey of Personal Incomes for tax year 2019 to 2020, Table 3.12
3. Sub-regional statistics
Income by county and region
The highest regional mean and median value for total income, £51,800 and £30,700 respectively, are found in London. The county with the highest mean and median value of total income was Surrey at £53,900 and £33,000 respectively. The lowest mean total income was £29,500 for South Yorkshire. The lowest median of total income was estimated for South Yorkshire at £23,500. (Table 3.13)
Income by borough and district or unitary authority
The highest mean value of total income was estimated in Kensington and Chelsea (£185,000) while the highest median value was in the City of London (£54,200). The lowest mean value of total income £24,900 was estimated in Blaenau Gwent and Blackpool UA, while the lowest median value was in Boston, £20,600. (Table 3.14)
Income by Parliamentary Constituency
The parliamentary constituency with the highest mean value of total income was Kensington (£172,000) while the highest median value was estimated in the Cities of London and Westminster (£45,900). The parliamentary constituency with lowest mean value of total income was Nottingham North, (£23,800). The lowest median value was in Leicester East and Boston & Skegness (£20,300). (Table 3.15)
Note
These values from tables 3.13 to 3.15 are sample based estimates; confidence intervals at the 95% level are available. For more information on estimates and measures of precision see the supporting documentation.
4. Contact Information
If you have any queries regarding this publication, please use the contact information below to get in touch.
Statistical contact: M Whent, spi.enquiries@hmrc.gov.uk
Media contact: HMRC Press Office, news.desk@hmrc.gov.uk
Website: Personal Income Statistics
Frequency: Published annually
Coverage: United Kingdom Theme: The Economy
Publication date: 13 April 2022
Next publication date: March/April 2023