Income-related benefits: estimates of take-up: financial year 2019 to 2020
Updated 26 October 2023
Applies to England, Scotland and Wales

© Crown copyright 2023
This publication is licensed under the terms of the Open Government Licence v3.0 except where otherwise stated. To view this licence, visit nationalarchives.gov.uk/doc/open-government-licence/version/3 or write to the Information Policy Team, The National Archives, Kew, London TW9 4DU, or email: psi@nationalarchives.gov.uk.
Where we have identified any third party copyright information you will need to obtain permission from the copyright holders concerned.
This publication is available at https://www.gov.uk/government/statistics/income-related-benefits-estimates-of-take-up-financial-year-2019-to-2020/income-related-benefits-estimates-of-take-up-financial-year-2019-to-2020
The Income-Related Benefits: Estimates of Take-up report looks at estimates of take-up for income-related benefits:
The pension age benefits covered are:
- Pension Credit (PC)
- Housing Benefit (HB) (for Pensioners)
Take-up refers to the receipt of benefits someone is entitled to and we estimate take-up in 2 ways:
- by numbers of people who claim these benefits (‘caseload’)
- by the amount these people claim (‘expenditure’)
Change since last release
There can be no new claims for any of the working-age benefits. This publication will therefore only focus on take-up for pensioners.
1. Estimates of Take-up by Caseload and Expenditure
Pension Credit
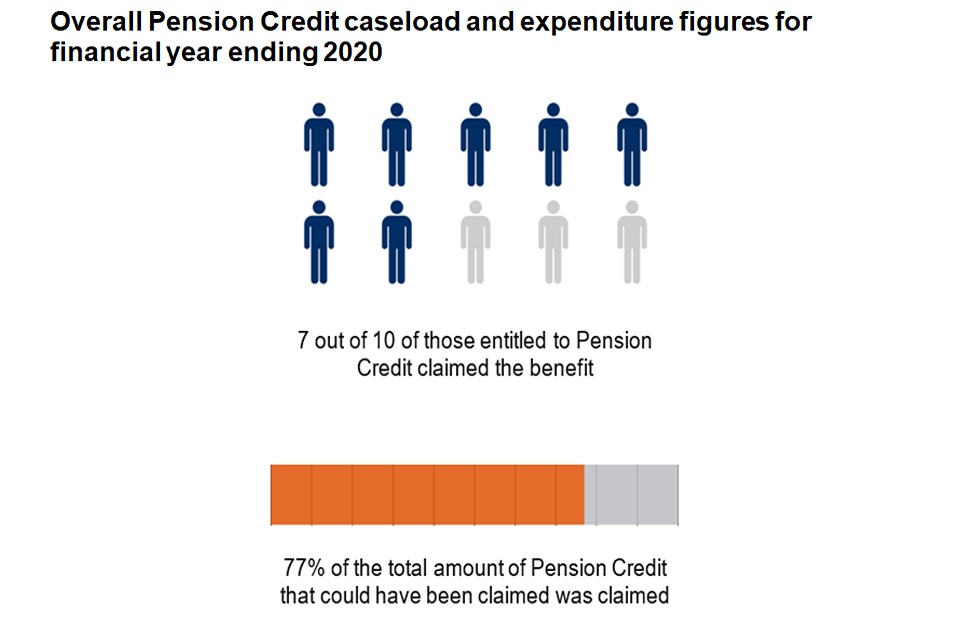
The estimates show that:
- caseload: 7 out of 10 of those entitled to Pension Credit claimed the benefit
- expenditure: 77% of the total amount of Pension Credit that could have been claimed was claimed
Housing Benefit (for Pensioners)
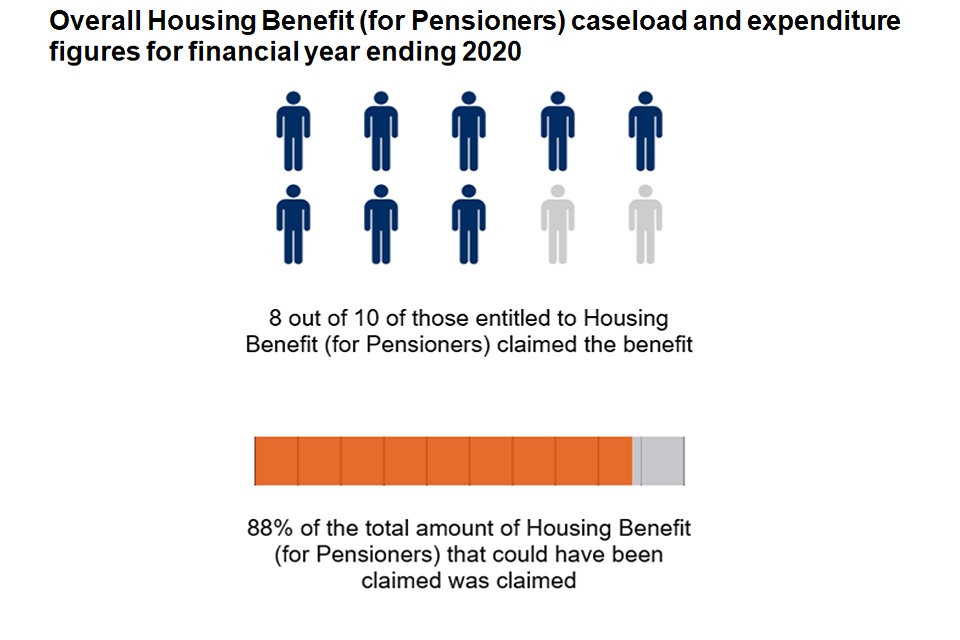
The estimates show that:
- caseload: 8 out of 10 of those pensioners entitled to Housing Benefit claimed the benefit
- expenditure: 86% of the total amount of Housing Benefit( for pensioners) that could have been claimed was claimed
2. Estimates of non-take-up for families and expenditure
Pension Credit
The estimates show that:
- caseload: up to 850 thousand families who were entitled to receive Pension Credit did not claim the benefit
- expenditure: up to £1.7 billion of available Pension Credit went unclaimed:
- on average, this amounted to around £1,900 per year for each family entitled to receive Pension Credit who did not claim the benefit
Housing Benefit (for Pensioners)
The estimates show that:
- caseload: up to 260 thousand pensioners who were entitled to receive Housing Benefit (for pensioners) did not claim the benefit
- expenditure: up to £1.1 billion of available Housing Benefit (for pensioners) went unclaimed:
- on average, this amounted to around £4,000 per year for each family entitled to receive Housing Benefit (for Pensioners) who did not claim the benefit
3. What you need to know
Introduction
This report provides estimates of the take-up for the following income-related pension age benefits in Great Britain for the financial year ending 2020 (FYE 2020):
- Pension Credit
- Housing Benefit (for Pensioners)
Take-up refers to the receipt of benefits someone is entitled to. There are some people who are entitled to benefits but have not claimed them. An income related benefit is a benefit where a potential claimant’s income is taken into account when deciding whether they are entitled to the benefit. This income can include income from savings or earnings.
Take-up of benefits can be affected by multiple factors. Trying to explain the reasons for non-take-up is difficult and we do not have data in our modelling to do this. Take-up may be affected by broad factors such as the attractiveness of the benefit, lack of awareness of the benefit or application procedure, lack of awareness of entitlement or the perceived stigma of receiving a benefit (Eurofound 2015).
Take-up statistics are not available at a lower level of geography than Great Britain. This is because the survey sample sizes for entitled non-recipients are too small to calculate take-up rates in smaller geographical areas. Similarly, Housing Benefit (for pensioners) take-up statistics are only available as totals. This is also because the survey sample sizes for entitled non-recipients are too small to be able to calculate take-up rates for sub-groups.
Family Resources Survey (FRS) Interviews were suspended in mid-March 2020 in line with the national lockdown. At this point, nearly a full year’s worth of FRS interviews had already taken place and there is no material impact of COVID-19 on the FYE 2020 FRS data.
From May 2019 both partners in a couple were required to have reached State Pension age to make a new claim for pension age benefits. The State Pension Age for FYE 2020 was 65 for both men and women.
From FYE 2020 onwards we are able to link to Universal Credit, Disability Living Allowance (mobility component), Personal Independence Payment, Tax Credits, Carer’s Allowance and Child Benefit as well as benefits that we have been linking to in previous years. This continues to improve the quality of the estimates as the modelling of estimates is based on more accurate data
Methodological refinements were applied to the data from FYE 2017. Therefore, comparisons to previous years should be treated with caution. These are indicated in the tables and charts by the use of a dashed grey line. See the revisions to the statistics section in the Background Information and methodology note for more details.
The charts which show the breakdowns of the take-up caseload and expenditure statistics include 95% confidence intervals. These 95% confidence intervals indicate the level of uncertainty in the take-up estimates as they are produced from sample data.
Content of the report
Take-up is estimated in 2 ways:
-
caseload – over a one-year period, the average number of benefit recipients who received each benefit compared to the number if everyone entitled to the benefit had claimed it
-
expenditure – over a one-year period, the average amount of a benefit claimed multiplied by the total number of people claiming it, compared to the total amount if everyone entitled to the benefit had claimed it
Note that the caseload figures are rounded to the nearest 10,000 and percentages are rounded to the nearest percentage point. Also note that for expenditure figures, the amounts claimed and unclaimed are rounded to the nearest £10 million and percentages are rounded to the nearest percentage point.
Take-up rates are estimated using a formula that gives a single, or ‘point’, estimate together with lower and upper bound estimates.
Throughout this report a ‘family’ refers to either a single adult or a married or cohabiting couple, and any dependent children.
In reporting average annual amounts unclaimed we have used mean weekly amounts to be consistent with the estimated total amount unclaimed. Information on median weekly amounts unclaimed is available in the reference tables.
Percentage point differences stated in this publication have been calculated on rounded percentages. Statistically significant differences in this publication are clearly stated. For more information on statistical significance see Section 7.
This report contains data from Financial Year Ending (FYE) 2013 to FYE 2020. Data for FYE 2010 can be found in the reference tables.
Further information
A set of reference tables breaking down headline results presented in this publication, along with a quick guide on how to use them, is available online here: Reference Tables and Guide. Data from these reference tables are referenced throughout this report.
4. Pension Credit
The estimated take-up rates for Pension Credit in FYE 2020 may be affected by two factors and their interaction. The first is linking to Disability Living Allowance (mobility component), Personal Independence Payment, Tax Credits, Carer’s Allowance and Child Benefit as well as benefits that we have been linking to in previous years. The second is the introduction of a new policy, in May 2019, which required both partners in a couple to have reached State Pension age in order to be eligible for a new PC claim may also have affected the estimated take-up rates for couples. This is because in the modelling all couples where one partner was above and the other below State Pension age were excluded from the analysis.
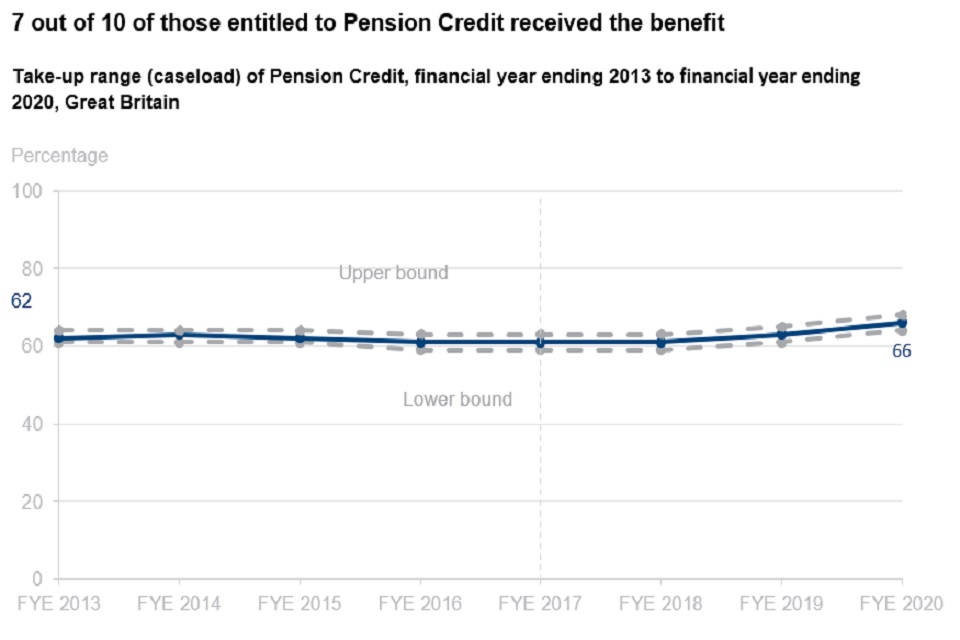
In the FYE 2020 an estimated 66% of families who were entitled to Pension Credit received it. The rate had been stable over the period FYE 2013 to FYE 2019. The take-up rate in FYE 2020 is 3 percentage points higher than in FYE 2019.
For the FYE 2020, take-up of Guarantee Credit (73%) continued to be higher than take-up of Savings Credit only (43%). This difference was statistically significant. This could be influenced by the difference in the average weekly amounts people were entitled to. The estimated average (mean) weekly amount unclaimed for Guarantee Credit (£57) was substantially higher than Savings Credit only (£6).
Take-up of Pension Credit by those aged under 75 continued to be higher than those aged 75 or over. This has generally been the story across the time period. In FYE 2020 caseload take-up was an estimated 68% for those aged under 75 and 65% for those aged 75 or over.
See Tables PC1, PC2 and PC9 for full data.
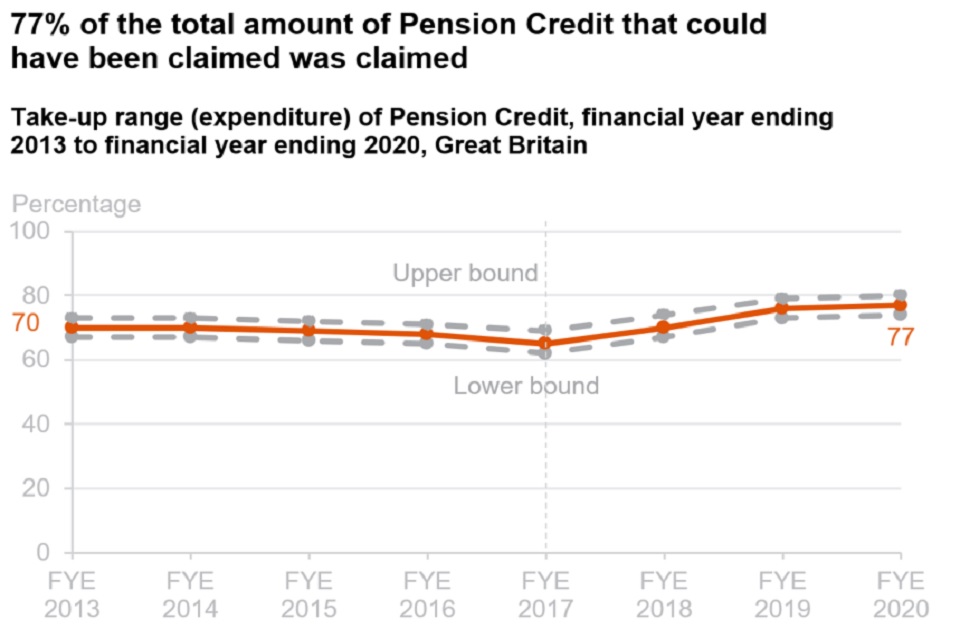
Expenditure take-up had been relatively stable since FYE 2013 until FYE 2016. In FYE 2020 an estimated 77% of the total amount of Pension Credit that could have been claimed was claimed. This was 1 percentage point higher than for FYE 2019.
Expenditure take-up of Guarantee Credit (77%) continued to be higher than expenditure take-up of Savings Credit only (48%). This difference was statistically significant.
Expenditure take-up of Pension Credit by those aged under 75 (76%) was the same as that of those aged 75 or over (76%).
See Tables PC2 and PC10 for full data.
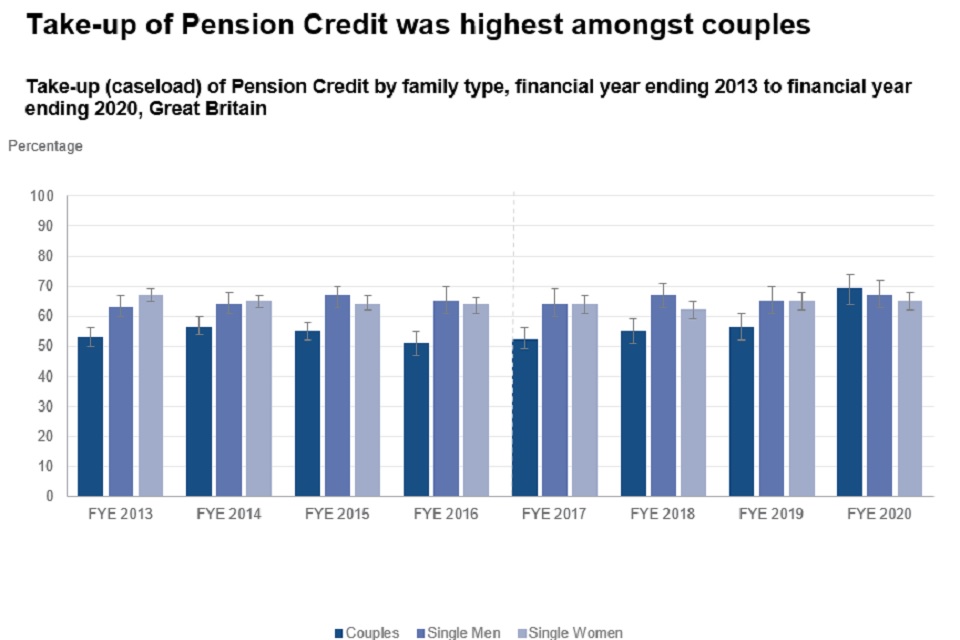
There have been consistent trends in the take-up of Pension Credit between couples, single men and single women for the period FYE 2013 to FYE 2019. For the FYE 2020, the caseload take-up of Pension Credit by couples (69%) is higher than that of single males (67%) and single females (65%).
See Table PC3 for full data.
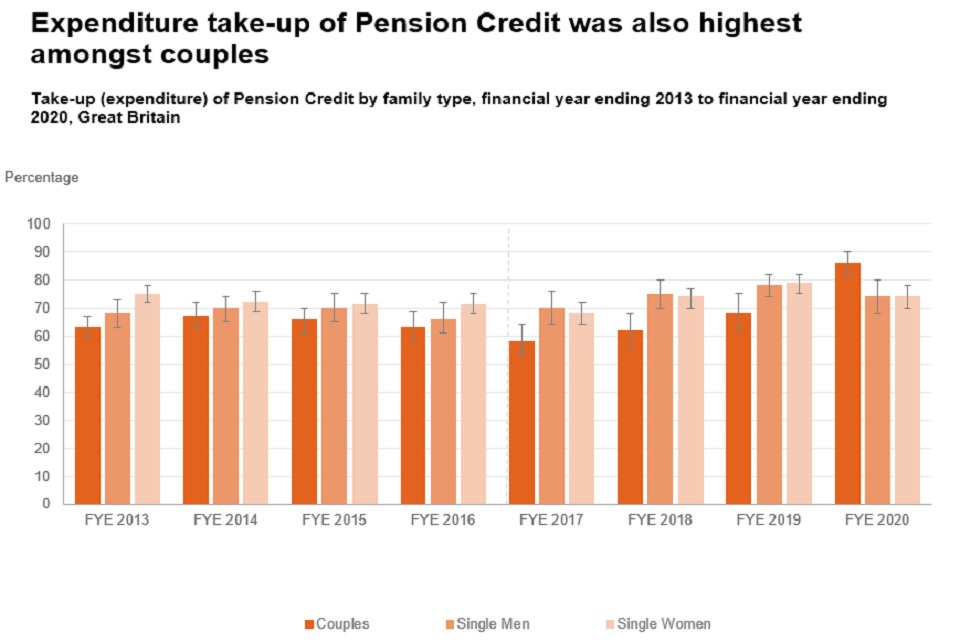
There have been broadly consistent trends in the take-up of Pension Credit between couples, single men and single women since FYE 2013. For the FYE 2020, expenditure take-up of Pension Credit by couples (86%) is higher than that of single males (74%) and single females (74%). The difference between couples, single males and single females is statistically significant. The smaller group of entitled non-recipients may on average be eligible for smaller amounts than previous years.
See Table PC4 for full data.
5. Housing Benefit (for pensioners)
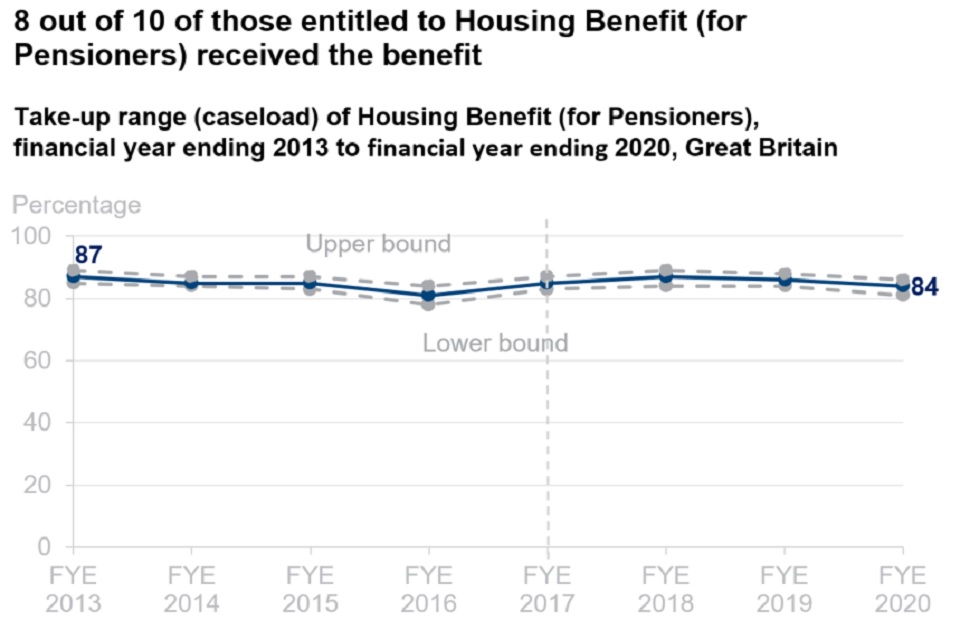
In the FYE 2020 an estimated 84% of pensioners who were entitled to Housing Benefit received it. The take-up rate in FYE 2020 is 2 percentage points lower than in FYE 2019.
See table HB1 for full data.
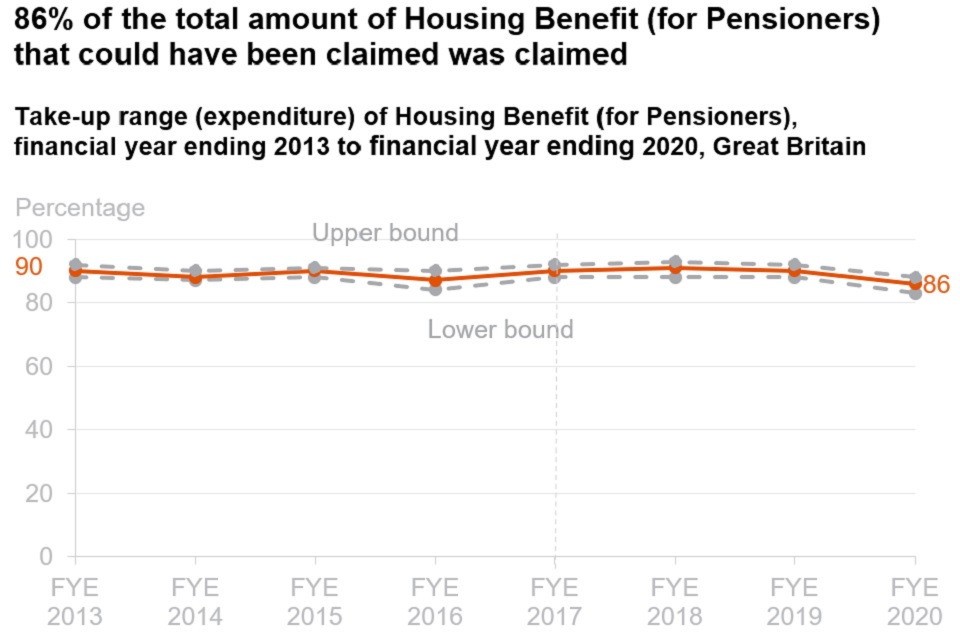
In the FYE 2020 an estimated 86% of the total amount of Housing Benefit (for pensioners) that could have been claimed was claimed. The take-up rate in FYE 2020 is 4 percentage points lower than in FYE 2019. The rate has been broadly stable over the period shown.
See table HB2 for full data.
The estimated take-up rates for Housing Benefit (for pensioners) in FYE 2020 may be affected by linking to Disability Living Allowance (mobility component), Personal Independence Payment, Tax Credits, Carer’s Allowance and Child Benefit as well as benefits that we have been linking to in previous years.
6. Overview of methodology
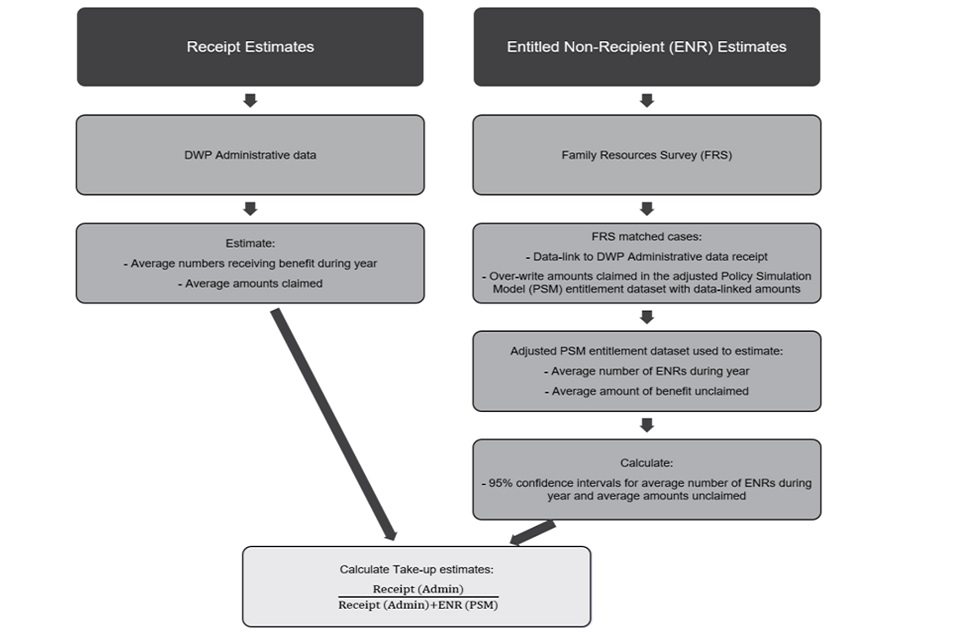
The methodology for deriving the estimates of take-up is complex. Figures in this report are based on Department for Work and Pensions (DWP) administrative data, local authority administrative data and data from the Family Resources Survey (FRS). The survey data from the FRS are then modelled using a static microsimulation model known as the Policy Simulation Model (PSM). The PSM is a model of the tax and benefit system of the UK. The source data for the model comes primarily from the FRS with benefit and tax credits entitlement and tax or National Insurance liability calculated for each FRS family.
To produce the take-up estimates, information can be taken from DWP administrative data sources to look at the average number of those in receipt of the benefit along with the average amount claimed. However, because administrative benefit entitlement data sets do not exist, survey-based estimates of the population and unclaimed amounts for those who are entitled but not receiving (ENRs) are needed. A combination of an adjusted data set from the PSM, which includes survey data linked to administrative data, and reported receipt from the FRS are used to produce these estimates. The data linking approach has continued to develop resulting in increasing match rates and making more use of administrative data over time.
The estimates for the ENRs are calculated with confidence intervals which provide a lower and upper range for the average number of ENRs and the average amount claimed. These estimates, along with the central estimates are incorporated into the take-up formulae. Caseload and expenditure take-up rates are estimated. A point estimate is calculated. The lower and upper bound estimates of those not in receipt are used to estimate lower and upper take-up bounds. Statistical tests are performed on the point estimates to identify significant differences between the take-up rates between years and between groups.
There are limitations to this methodology, but it aims to produce the best take-up estimates based on the evidence available.
Take-up of benefits can be affected by a number of factors. Trying to explain the reasons for non-take-up is difficult and we do not have the data in our modelling to do this. For more information on the factors which can affect take-up section 7.
See the Background Information and methodology note for more information.
7. About these statistics
Official statistics
As an Official Statistic, Income-Related Benefits: Estimates of Take-up is fully compliant with the code of practice for statistics.
Where to find out more
Income-related benefits has further outputs and reference tables from take-up analysis, alongside our background information and methodology note which provides further detail on methodology and recent policy changes which may affect benefit take-up.
The background information and methodology note also includes information on issues relating to the take-up of benefits which were reviewed in a paper by Eurofound.
Read more information about Eurofound:
DWP statistics on benefit receipt and expenditure:
Information on entitlement and how to claim a benefit.
A guide to the different definitions of earnings and income, with information on alternative sources of data.
More useful information on income and earning statistics.
Other National and Official statistics
Read a schedule of DWP’s statistical releases over the next 12 months and a list of the most recent releases.
In accordance with the Code of Practice for Statistics, DWP statistics are also announced in the GOV.UK statistics release calendar.
Using the take-up estimates for analysis
Survey data
This publication is based on modelled survey data – it is therefore subject to sampling variation and other forms of error associated with a sample survey. Relative to administrative records the FRS under-reports benefit receipt. See the FRS background information and methodology note for more details. The FRS survey data used in the production of take-up statistics is not designed specifically to measure entitlement criteria to the same extent as an application for a specific benefit. It is a multi-purpose household survey.
Sample
Due to the restrictions in modelling and available data, certain populations are excluded from our analysis. The figures presented in this publication and accompanying reference tables only include those living in private households in Great Britain. As a result of the exclusions noted, recipient totals and expenditure estimates in this report may differ from those in other published sources.
Sampling error
Results from surveys are estimates and not precise figures – in general terms the smaller the sample size, the larger the uncertainty.
Policy Simulation Model
As a model, the PSM is subject to a range of assumptions, beyond that of a typical survey. Of particular importance to take-up statistics are the methodologies for estimating entitlement and specific assumptions for making population estimates from the sample (known as grossing). These are described in more depth in the Background information and methodology note.
Statistical significance
This is a technical concept that says whether a reported change is likely to have arisen only by chance due to variations in the sampling. We calculate 95% confidence intervals around estimates in take-up which sets a standard that, where any change is reported as statistically significant, there is less than a 1 in 20 chance that the reported difference is due to sampling variation and there is no real underlying change.
Statistically significant differences in this publication are clearly stated.
Interpretation
Care should be taken when interpreting take-up statistics. For instance, if the upper limit of a caseload take-up range is 90%, this does not mean that at least 10% of the entitled population never take up their entitlement. This is because some of the shortfall in take-up may represent a delay in claiming or processing benefit that is eventually received. The confidence intervals are therefore used to represent the range in which we estimate the overall true rate of take-up, averaged over the whole year, lies.
Enquiries and feedback
DWP would like to hear your views on our statistical publications. If you use any of our statistics publications, we would be interested in hearing what you use them for and how well they meet your requirements. Send your comments by email to: irb.takeup@dwp.gov.uk.
Press enquiries should be directed to the DWP Press Office, telephone: 0115 965 8781.
Enquiries about these statistics should be directed by email to: irb.takeup@dwp.gov.uk
Producers of this release:
Narayan Jayaram, Jonathan Howard, Michael Lind and Luke Herzberg
Responsible statistician: Joanne Burrage
ISBN: 978-1-78659-318-4
Next edition October or November 2022