
Mobile commerce or mcommerce is a subset of ecommerce that involves the buying and selling of goods through a mobile device like a smartphone or a tablet. As users acquire devices with extensive features and data plans become more accessible, users are now finding it easier than ever to shop on mobile. And with people stuck at home due to pandemic-related lockdowns and restrictions, mobile shopping enjoyed a huge boost, especially during the holidays.
In this article, you can get to know various mcommerce statistics from market size to forecast growth to insights into different branches of mcommerce such as mobile shopping, payments, and banking. With data about the mcommerce industry and consumer behavior, you can better understand what the future of mcommerce is. Moreover, this can help you equip your business and conquer the unique challenges of ecommerce to steer your endeavors to success.

Mcommerce Statistics Table of Contents
General mCommerce Statistics
Mcommerce is poised to take off in the next few years, especially with the increased adoption of mobile devices and apps that make mobile shopping easier. Because of this, we can expect mcommerce to grow at double-digit rates until 2024. The share of mcommerce is also expected to reach about half of the total ecommerce market share. The mcommerce market is especially strong in China, the US, and the UK.
mCommerce Market Size, Revenue, and Sales
- Industry forecasts show that mcommerce will comprise 45% of the total US ecommerce market, reaching $284 billion. (Business Insider, 2020)
- mcommerce volume is expected to increase at a compound annual growth rate (CAGR) of 25.5% from 2019 to 2024. (Business Insider, 2020)
- The volume of smartphones in the US is projected to increase from $128.4 billion in 2019 to $418.9 billion in 2024. (Business Insider, 2020)
- Tablets are expected to grow with a CAGR of 18.9% from 2019 to 2024. By 2024, people will spend a total of $69 billion in tablets. (Business Insider, 2020)
- By the end of 2020, mobile-ecommerce spending in the US amounted to $47.8 billion. (Comscore, 2020)
- The ecommerce market is expected to grow to $845 billion by 2022, over 50% of which will be driven by mobile commerce sales. (Forbes, 2020)
- Retail mcommerce sales in the US reached $388.02 billion in in 2019. (eMarketer, 2019)
- The mobile coupon industry is expected to grow by 56.5% by 2025. (Magneto, 2020)
Souce: eMarketer, 2019
Top mCommerce Markets by Country
- The top mcommerce markets are China ($0.75 trillion), the US ($0.21 trillion), the UK ($63.8 billion), Japan ($34.5 billion), and South Korea ($28.8 billion). (Magneto, 2020)
- From July to August 2020, mcommerce accounted for 33% of total digital commerce dollars in the US (Comscore, 2020)
- Mobile users in the UK spent an an estimated $72 billion on mobile devices. By 2023, this spend is expected to reach $116 billion. (Worldpay, 2020)
- In China, there are an estimated 788 million mobile commerce users. (Statista, 2020)
- By the end of 2020, the penetration rate of online shopping in China reached 79.1%. (Statista, 2021)
State of mCommerce
- Since 2019, about one in three dollars is spent on mobile commerce versus total digital spend. (Comscore, 2020)
- Consumer spend on mobile increased by 16% year on year in the second quarter of 2020 compared to desktop at 5%. (Comscore, 2020)
- From November 1 to December 9, 2020 alone, mobile shoppers in the US spent $53.2 billion, which increased by 55% year on year. (App Annie, 2021)
- In 2021, mobile apps consumer spend is expected to reach $92 billion for apps in the Apple App Store and $50 billion for apps in Google Play. (SensorTower, 2021).

Mobile Shopping Statistics
Mobile shopping tends to be popular among the younger generations, particularly Gen Z users. However, Gen X and Baby Boomer users have also increased time spent on mobile apps. In terms of location, data shows that mobile users from Asian countries tend to make purchases via mobile device compared to other countries, even exceeding the global average. The holidays were also the most active times for mobile shoppers to purchase items for themselves or their loved ones.
Mobile Shopper Demographics
- Mobile buyers account for 60.9% of the US population. By 2024, around 187.5 million users in the US will have made at least one purchase via a browser or app on their mobile phones. (Statista, 2020)
- Gen Z mobile users have 60% more sessions per user in top apps compared to users from older demographics. (App Annie, 2020)
- Gen Z mobile users spent an average of 3.8 hours per month among the top 25 non-gaming apps. They also spent an average of 150 sessions per app per month for the top 25 non-gaming apps. (App Annie, 2020)
- In 2020, Gen X and Baby Boomer users had a 30% year-on-year growth in total time spent on the top 50 apps. On the other hand, total time spent on apps grew by 18% for millennials and 16% for Gen Z users. (App Annie, 2021)
- Lastly, Asian countries have a high percentage of their online population making a purchase via a mobile device. Topping the list is Indonesia (79.1%), Thailand (74.2%), and the Philippines (69.6%). These rates are higher than the global average of 55.4%. (DataReportal, 2021)
Asian Countries With the Highest Mobile Commerce Transactions
Source: DataReportal, 2021
Designed byMobile Shopping Behavior
- During the 2020 holidays, 75% of ecommerce shopping was done on a mobile device but only around 40% turned into sales. (Forbes, 2020)
- Moreover, 79% of smartphone users have made a purchase online using their mobile device in the past six months. (Magneto, 2020)
- 87% of shoppers look up a product first online before making a purchase. (Magneto, 2020)
- Mobile apps achieve three times more conversions compared to mobile sites. (Magneto, 2020)
- During the 2020 holiday season, 40% of revenue from sales in the US came from smartphones. (Adobe, 2020)
- During the 2020 holiday season, US retailers saw 52% of online spend come from smartphones. This marked the first time that mobile spend reached over 50%. (Adobe, 2020)
- Consumers are spending 35% more time on mobile in 2020 compared to 2017 and 2018. (App Annie, 2020)
- In 2020, mobile Android users spent 4.2 hours per day on their phones. Daily time spent per mobile user saw a 20% year-on-year growth compared to 2019. (App Annie, 2021)
- Time spent by mobile users worldwide on shopping apps increased by 30% year on year. (App Annie, 2021)
- As of the second quarter of 2020, tablets had the highest conversion rates for online shoppers in the US. Desktops are the second highest-converting device at 2.1%, followed by mobile phones at 2.01%. (Kibo Commerce, 2020)
- The most popular mobile shopping apps in the US were Amazon (80.64%), Walmart (46.08%), and eBay (33.28%). (Statista, 2019)

mCommerce Payment Statistics
The use of digital payments is gaining traction spurred by the need for contactless payment options to contain the spread of the COVID-19 virus. Forecasts for the adoption of digital wallets are showing great promise, with certain countries expected to go cashless in the next few years. However, one of the great barriers to digital wallet adoption is consumer concerns about privacy and lack of knowledge on how digital wallets work.
- Millennials comprise 35% of mobile wallet users. (Magneto, 2020)
- Digital or mobile wallet transactions comprised 44.5% of total ecommerce transactions by volume worldwide, beating out other payment methods like credit cards (22.8%) and debit cards (12.3%). This figure increased by 6.5% compared to 2019. (Worldpay, 2021)
- Experts predict that digital wallets will account for 51.7% of ecommerce payments by volume in 2024. By that time, it will also account for 84.5% of ecommerce spend. (Worldpay, 2021)
- Denmark, Sweden, and Norway are expected to be nearly cashless in the next five years. (Worldpay, 2021)
- 28% of consumers in the US are currently using mobile wallets, up from 22% in 2018. (Vibes, 2019)
- 71% of US consumers are interested in trying a mobile wallet. However, 65% cite security concerns while over 70% say that they don’t know how to use a mobile wallet and whether their phones move mobile wallet capabilities or the places they shop would accept mobile wallets. (Vibes, 2019)
- Shopping was the most popular use of brand apps, beating out others at 66%. Other uses for brand apps were financial (29%), restaurants (19%), and travel (18%). (Vibes, 2019)
Consumer Reasons for Not Using a Mobile Wallet
Security concerns: 65%
Security concerns
65%Don't know how to access or use mobile wallets: 17%
Don't know how to access or use mobile wallets
17%Don't know where mobile wallets are accepted: 17%
Don't know where mobile wallets are accepted
17%Don't know what mobile wallets are: 15%
Don't know what mobile wallets are
15%Don't know how to tap-to-pay at a store: 15%
Don't know how to tap-to-pay at a store
15%Most stores I frequent do not offer this payment type: 13%
Most stores I frequent do not offer this payment type
13%Don't know if my phone has a mobile wallet: 13%
Don't know if my phone has a mobile wallet
13%Other: 6%
Other
6%Source: Vibes, 2019
Designed byMobile Banking Statistics
The ease of use and flexibility that mobile banking brings has drawn online users to mobile banking apps. Because of this, there is generally a high percentage of users who have done banking activities through a mobile device. Consumers have come to expect convenience and privacy out of mobile banking apps while banks leverage them to provide users with customized offerings. Despite its prevalent usage, traditional mobile banking apps are facing competition with fintech apps, which include not only banking apps but also budgeting and investment apps.
- More than one billion phone users have utilized mobile banking. (Magneto, 2020)
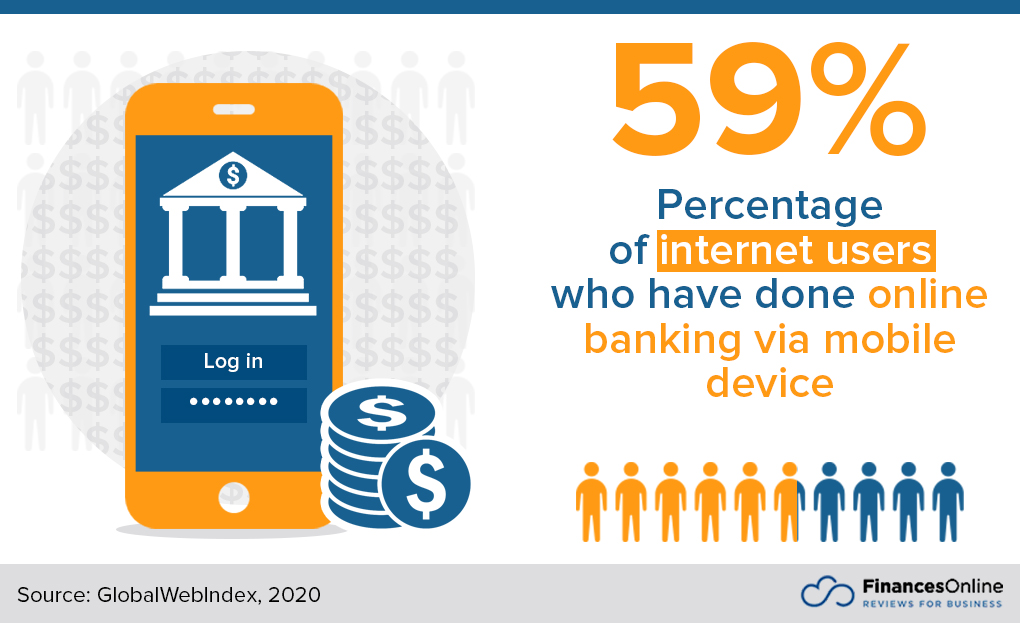
- 59% of internet users have done online banking via a mobile device. (GlobalWebIndex, 2020)
- Time spent on finance apps increased 45% year on year worldwide outside of China. (App Annie, 2021)
- 62% of Europeans use a mobile banking app to avail of banking services. (Magneto, 2020)
- By 2023, 72% of adults in the UK will use an app to do mobile banking. (Magneto, 2020)
- The top feature that users in the US and the UK want out of mobile banking apps is biometrics for more secure transactions. (GlobalWebIndex, 2020)
- 36% of Gen X users said they are willing to use biometrics for easier mobile banking while 34% of millennials said the same. On the other hand, 32% of both Gen X and millennial users said that they would like to have easy access to credit within mobile banking apps. (GlobalWebIndex, 2020)
- 83% of consumers are more likely to engage with loyalty programs if it is easily accessible from their mobile phone. This figure increases to 94% for millennial consumers. (Forbes, 2019)
- 43% of mobile banking users want brands to give them customer-centric services to make their daily lives easier, while brands want to provide users with personalized offerings. (GlobalWebIndex, 2020)
- Fintech apps are disrupting the market share of traditional banking apps. The global average monthly active users of the top 10 fintech apps grew 20% year over year in 2019. Meanwhile, the global average monthly active users for traditional banking apps grew by only 15%. (App Annie, 2020)
- Fintech wallet apps have a higher session time per user per week than wallet apps from traditional banks. This amounts to an additional 52 sessions per year for fintech wallet apps. (App Annie, 2020)
mCommerce During the Pandemic
The sudden shift from in-store to online shopping due to the pandemic has only served to accelerate the rise of mcommerce. This has led consumers to shop on mobile more often than they did on other devices. The preference for mobile is especially true for younger users than older ones. Other forms of mobile shopping such as live-stream shopping and WeChat shopping are also gaining ground.
- Around 80% of shoppers have said that they have shopped more often on mobile since the start of the pandemic. (Forbes, 2020)
- At the outset of the COVID-19 pandemic, 39% of US consumers said that they often shopped online via mobile websites. On the other hand, 30% shopped on websites from PCs while 27% shopped through apps on mobile devices. (Namogoo, 2020)
- During the COVID-19 outbreak, mobile shopping apps decreased by 1.9% for Chinese consumers. However, live streaming shopping increased by 6.3%. Shopping via WeChat has also increased by 4% and shopping via short videos by 2.6%. (Statista, 2020)
- 47% of Australian consumers believe that there will be less use for cash after the COVID-19 pandemic. (PayPal, 2020)
- Between March to April 2020, shopping apps reached 14.4 million downloads in the US, representing a 20% increase compared to January of the same year. (eMarketer, 2020)
- In a survey, 59% of US adults said that they preferred to shop on their mobile phones. (eMarketer, 2020)
- Younger consumers in the US prefer to shop on mobile compared to older consumers. 90% of US consumers aged 25 to 34 preferred this mode of shopping, while only 18% of consumers aged 65 and above said the same. (eMarketer, 2020)
How Consumers Shopped Online During the Pandemic
Websites on mobile devices: 39%
Websites on mobile devices
39%Websites on PCs: 30%
Websites on PCs
30%Apps on mobile devices: 27%
Apps on mobile devices
27%Don't shop online: 4%
Don't shop online
4%Other: 1%
Other
1%Source: Namogoo, 2020
Designed byWhat is the Future of mCommerce?
These mobile commerce statistics for 2021 predict how mcommerce might soon capture a significant chunk of the ecommerce market. With the rise in mobile device adoption, such forecasts will most likely come to fruition. The convenience that mcommerce offers to consumers to shop, make payments, and do banking transactions while untethered to a stationary device, will only further increase its adoption into the mainstream. However, the challenge remains for mcommerce providers to protect consumer privacy and provide personalized offerings as consumers expect more from such apps.
If there is anything that can be gleaned from the pandemic, it is that brands and retailers are missing out if they do not have an mcommerce strategy in place. At a time when consumers have plenty of ecommerce platforms to get the products and services that they need, mcommerce can be a differentiator, complement your other distribution channels, and help businesses capture revenue across different demographics.
References:
- Adobe (2020). Reviewing 2020’s Holiday Shopping Season. Retrieved from adobe.com
- App Annie (2021). The State of Mobile 2021. Retrieved from appannie.com
- App Annie (2020). The State of Mobile 2020. Retrieved from appannie.com
- Ernest-Jones, S. (2020, February 27). Cashing in on banking trends: a guide for brands. Retrieved from blog.globalwebindex.com
- Essling, I. & Williams, R. (2020, October 19). 2020 State of Retail. Retrieved from comscore.com
- Kemp, S. (2021, January 27). DIGITAL 2021: GLOBAL OVERVIEW REPORT. Retrieved from datareportal.com
- Etzioni, E. (2020). Consumer Survey: How COVID-19 Online Shopping Habits are Shaping the Customer Journey. Retrieved from namogoo.com
- Kats, R. (2020, July 15). More Consumers Are Shopping Via Mobile amid the Pandemic. Retrieved from emarketer.com
- Kibo Commerce (2020). Ecommerce Quarterly Benchmarks Trends & Behaviors In The COVID Era. Retrieved from kibocommerce
- Koch, L. (2019, April 7). Mobile Web vs. Mobile App: Where Do Shoppers Spend Time and Money?. Retrieved from emarketer.com
- Kohan, S.E. (2020, February 9). Mobile Commerce To Grow 68% By 2022 As More People Shop On Their Phones. Retrieved from forbes.com
- Kohan, S.E. (2020, September 22). Retail’s New Normal? Mobile Shopping Expected To Hit $314 Billion This Year. Retrieved from forbes.com
- Magneto (2020). Future of Mobile Commerce: Stats & Trends for 2020 – Infographic. Retrieved from magnetoitsolutions.com
- Meola, A. (2020, December 31). Rise of M-Commerce: Mobile Ecommerce Shopping Stats & Trends in 2021. Retrieved from businessinsider.com
- Morgan, B. (2019, May 3). When It Comes To Customer Engagement, Loyalty Matters At Citi. Retrieved from forbes.com
- PayPal (2020, November). PayPal 2020 eCommerce Index. Retrieved from paypalobjects.com
- Sensor Tower (2021, February 22). 5-Year Market Forecast: App Spending Will Climb to $270 Billion by 2025. Retrieved from sensortower.com
- Statista (2021, February). Penetration rate of online shopping in China from 2010 to December 2020. Retrieved from statista.com
- Statista (2020, March). Number of mobile e-commerce users in China from 2016 to 2019 with an estimate for 2020. Retrieved from statista.com
- Statista (2020, July). Number of mobile buyers in the United States from 2020 to 2024. Retrieved from statista.com
- Statista (2020, June). Change on usage of shopping channels compared to before coronavirus COVID-19 in China as of May 2020. Retrieved from statista.com
- Statista (2019, November). Most popular mobile shopping apps in the United States as of September 2019, by reach. Retrieved from statista.com
- Vibes (2019). 2019 US Mobile Consumer Report. Retrieved from vibes.com
- Worldpay (2021). The Global Payments Report 2021. Retrieved from worldpay.globalpaymentsreport.com.


Leave a comment!